Published May 21, 2010 07:05PM
My Island, My Map: Creating a Custom Map of Bainbridge Island
If you think you missed the age of exploration and discovery, you haven't tried the latest mapping tools. Join our tech scout as he learns how to hike like a cartographer--and sees the wilderness in an entirely new way.
'bainbridge island map'
DOWNLOAD THE GOOGLE MAP>>
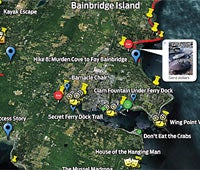
With an iPhone and Google Earth, the author made a multimedia map of Bainbridge island with geotagged photos, videos, even links to songs, and more.


More Mapping Tools
Use our cheat sheet to get mapping.
The first map of Bainbridge Island, Washington,was created by George Vancouver, one of the last of the British Empire’s great seafaring cartographers. In the spring of 1792, Vancouver dropped anchor at a rocky point near the island’s southern end and sent his men out to map the meandering coastline. Using sextants and marine chronometers–the GPS units of the day–Vancouver and his men produced coastal charts so accurate that they were used for the next half century.
ADVERTISEMENT
Vancouver’s accuracy was widely renowned but it wasn’t perfect. He and his men missed the minor detail that the island that would later be called Bainbridge was, in fact, an island. As mistakes go, that’s a big one. But it wasn’t even Vancouver’s most famous whiff. A few weeks earlier he and his crew sailed right past the Columbia River and failed to note its presence.
It’s instructive to keep Vancouver’s screw-ups in mind when undertaking a mapping project. Cartography, as practiced for centuries, was a rarefied skill that combined science, art, adventure, and luck. In Vancouver’s era, it was often much more difficult–and important–than anything else an explorer did. To map a place was to prove it existed.
In that light, we live in an unprecedented moment in the history of mapping. Until recently, you essentially had one choice: Head to the local retailer or ranger station, buy whatever map was available, roll it up. But today, a massive merging of technologies–everything from GPS to digital photography and video, 3G wireless, Google Earth, GIS layering, smartphone apps, and on-demand map and even book publishing–has radically democratized the world of cartography. GPS units and smartphones can track a hiker’s movements with spooky precision. Google Earth offers a satellite view of the planet as a blank template on which to layer routes, waypoints, photos, video, links, and text annotations. Websites like MyTopo.com let you create your own custom waterproof maps using detailed USGS quads as a base layer. You can even hand-draw your own maps entirely from scratch with software like MapDiva’s Ortelius. With instant publishing sites like blurb.com, you can bundle it all into your own hardcover guidebook–shiny jacket, author photo, and all–and have it delivered to your buddy’s door within a week. Imagine what Vancouver would give to have a do-over with today’s cartography tools.
ADVERTISEMENT
What’s now possible is the ability to map any patch of land you can put your boots on, from remotest Alaska to your own backyard. And more–the ability to map those places with unprecedented detail, allowing any average Joe to engage in a revolutionary intimacy with any landscape he desires. For me, the desire has been local: to make my new home feel like home.
Last summer, I decided to put these new tools to the test by hiking my way around the coast of Bainbridge Island and mapping it as I went. George Vancouver might have made the first map of the island, but I would make the last. Or at least the latest. And if a guy with zero cartographic experience could take on one of history’s greatest explorers, imagine what you could do in your own favorite park or wilderness. My family and I moved to Bainbridge, a semi-rural island eight miles west of Seattle, about a year ago. We’ve been life-hopping the past few years, looking for home, and we think we’ve found it here. The schools teach art and science, the neighbors don’t cook meth, and the trees-to-asphalt ratio is off the charts. There’s only one thing missing: sense memory. We’re strangers, the island and me. It’s my firm belief that there’s no better way to understand a place, to really know it, than to lace up a pair of boots and start walking. So last summer, that’s exactly what I did.
I announced my plans at dinner. “I’m going to hike all the way around the island,” I told the family. “A circumnavigation. And I’m going to map the island as I go.”
ADVERTISEMENT
“Is that possible?” my 11-year-old daughter Lucy asked.
“Absolutely!” I said. In land mass, Bainbridge isn’t much bigger than Manhattan, but its jigsaw coves stretch its coastline to 53 miles, nearly twice that of the Big Apple. Fifty-three miles sounded perfect: challenging, but well within the realm of the possible.
I told a neighbor the plan. “Is that legal?” he asked.
That seemed to be an open question. Private property fringes much of Bainbridge’s coast, and shoreline access laws are like liquor laws: They vary wildly from state to state and there’s often little in the way of logic or reason behind them. “Maybe,” I answered. “Maybe not.”
ADVERTISEMENT
My 21st-century sextant: an Apple iPhone 3GS, loaded with the MotionX-GPS app. The combination would track my progress and let me collect routes, waypoints, and geotagged data. At home I would use the information to make a custom hiking map that clarified public access issues, and create a multimedia digital map with photos, video, and more. I’d even publish a guidebook that would serve as a family record and souvenir from the first year in our new home.
Day one: the shakedown cruise. My eight-year-old son Willie joined me for the inaugural leg, which began at Blakely Harbor, about a mile from our house. “How long do we have to walk?” Willie asked.
“Until we get there,” I said, calling upon the wisdom of a thousand fathers before me.
A quiet cove ringed by madrona trees and million-dollar houses, Blakely Harbor is an industrial ruin slowly being reclaimed by fir trees, pickleweed, and salt-tolerant sedges. A century ago the largest lumber mill in the world roared full tilt here. Today, kingfishers and great blue herons make their living where mill hands once plied their trade.
Willie and I walked northeast, collecting crab shells as we went. We hadn’t gotten far when the tide came in and pinned us against a small cliff. “What now, Dad?” Willie asked.
Hmm.
ADVERTISEMENT
Most of my hiking has been done in the mountains, where topography, slope, elevation, ground cover, forest overstory, and weather dictate the route and set the tenor of the day. Along the shore there’s really only one factor.
“The tides, Willie,” I said. “It’s all about the tides.” We retreated. Obviously I’d need to map more than coves and cool tide pools. I’d need to chart the tides.
It turns out there’s an app for that. A little research turned up an iPhone app called Tide Graph. For a one-time $1.99 download fee, it offered a graph of current and future tidal movements at any location in America.
ADVERTISEMENT
Tide Graph so improved my hiking life that I called up its creator, Bryan Aamot. “I have a small boat in Long Beach, California, and there’s a bridge near my house that I can’t clear when the tide’s high,” he explained. “One day I forgot about the tide and got caught out.” So he hammered out his own tide app. It’s been among the iPhone’s top 20 navigation apps for more than a year now, proving that–with today’s technology–even personal navigation projects can become widely useful. (The app is so essential to shoreline hiking that I embedded a download link in my Google Earth map. Try that on a USGS topo.)
Using Tide Graph, Willie and I resumed our hike a couple of days later at a minus-two-foot tide. We discovered a drowned 30-foot madrona tree that fell onto the beach and became a marine nurse log, hosting thousands of barnacles and blue mussels (Mytilus trossulus), the predominant native mussel of Puget Sound. No other map in the world has it marked. Mine does.
High tide floods Bainbridge’s shore twice a day, which kiboshed the notion of circling the island in a few long hikes. I’d have to work within a daily five-hour low-tide window.
ADVERTISEMENT
But that wasn’t my only concern. Often just reaching the beach proved a problem. Bainbridge’s swankiest houses are along the shore, and the owners of $1.5-million properties get ornery when strangers trespass to reach the beach. A handful of public-spirited islanders have fought to establish access points, which they’ve published online. But in my ground-truthing of the shoreline, many “public access points” turned out to be “nonexistent access points.” Maps that don’t conform to reality are the most frustrating kind, so I developed a strategy and made a vow: I’d hike access point to access point, and my map would include only those that could actually be found.
Because the incoming tide often precluded a return hike, I worked a variation of the old chicken-and-fox-cross-a-river solution. I’d drop off my bicycle at one access point, drive the van to the other end of the section, hike the shore, and pedal the back roads to return.
The new strategy helped me trace the shoreline in discrete chunks up to about four miles long. And by hiking at low tide I discovered unexpected treasures. At Murden Cove, for example, I found dense beds of living sand dollars that are exposed when the water recedes. These weren’t the bone-white medallions that wash ashore like four-leaf clovers of the sea. They were purplish-black, covered by tiny hairlike spines that trap organic particulates, and piled on top of and beside one another like a dropped stack of dinner plates. Like most things in nature, the chaotic arrangement is no accident. Perching slightly oblique to the tide and current allows the sand dollar to capture more food in the drift. I took a picture and put it on the map.
ADVERTISEMENT
Before starting my circumnavigation, I’d imagined finding spots just like Murden Cove–quiet stretches of shoreline where I could hike by myself, or with family and friends. Places like the Lost Coast, where a mile-long trail leads from a wildlife preserve to a pristine beach. But I never imagined the surprises you only find by mapping as you go–instead of leapfrogging to locations others have marked. I paced off Rockaway Beach, Bainbridge Island’s own gold coast, which, curiously, abuts an old creosote factory that’s now an EPA Superfund site. I stood at the dock site where the island’s Japanese Americans were taken away during World War II, forced into relocation camps for doing nothing more than symbolizing America’s post-Pearl Harbor fears. Clams under the ferry dock treated me to a mesmerizing show of spouting fountains while, above, dozens of drivers sat impatiently in their cars, oblivious to the natural wonder going on below. Who knew?! Readers of my map will.
As I waypointed clams and madrona trees and other discoveries, it occurred to me that I was practicing the mapping equivalent of the locavore movement. Call it locartography, and tell Lonely Planet and Trails Illustrated they have a new competitor: you.
As I made my way around the island’s northern tip–hikes 10, 11, and 12–my maps began to take shape. The iPhone let me email my tracks, waypoints, and photos to my home computer, where I’d pour the data into a Google Earth map of the island. That makes it sound easy. It was not.
ADVERTISEMENT
Locartography in the year 2010 is fabulous, but it’s not seamless. Everything that should take two steps often takes five. You can’t just upload photos onto your Google Earth map from your hard drive, for instance. They first need to be uploaded to an online photo service like Photobucket. Ditto with video, which must be posted on YouTube to be inserted into a Google Earth map. Doing anything beyond a simple waypoint addition will have you googling up wiki helpers (try “How to post video on Google Earth,” for example), which do the trick but shouldn’t have to. Since most custom-mapping tools, technologically speaking, have only just been born, you will encounter some futzing. (To learn from my trial-and-error education, see page 90.)
Tech challenges aside, the actual process of mapping presented cartographic brainteasers I’d never envisioned. Three-quarters of the way around the island, for instance, I ran into conceptual issues. Old-school maps are great at illustrating the physical world, but not so deft at capturing the fleeting nature of experience. I was building a crackerjack database of access points, trails, mussel hotspots, staircases, headwalls, tide pools, and sand dollar beds. It’s a more difficult thing to catalog the range of emotions triggered by the wind, tide, light, and sand: sadness, joy, relief, anxiety, boredom, wonder. Epiphany about troubled friendship experienced here. What would that look like on a map? I started embedding old photos. Linking to songs. Inventing icons.
When a thief escaped the local police by jumping in a sea kayak and paddling away, I found some perverse satisfaction in living on an island where criminals use kayaks as getaway cars. I waypointed the spot and annotated it with the police report. And what to do with the tip of Wing Point? Puget Sound’s tidal currents swirl and crash around this spot, forming an amazing knife-edge ridge of moraine cobble (left over from the ice-age glacier that carved the basin of the Sound). The spit tapers thinner and thinner until it narrows to a handful of rocks that disappear into the water. Wander out here when the tide’s rising and the ferry chugs past, on its way to Seattle, and you’ll feel vulnerable, conspicuous, and alone. Can’t go there yourself? Go to my Google map and watch the attached video.
ADVERTISEMENT
Eventually, mapping the island led me to a feeling akin to what the French call esprit de l’escalier, wit of the staircase, the sadness upon thinking of the perfect witty comeback just as you’re leaving the party. As I neared the end of the circumnavigation, I discovered many things that I wish I had begun mapping from the start. Pipes of mystery, for example. Bainbridge Island’s shoreline bristles with them. Old pipes, new pipes, big pipes, and small pipes channel the outflow from drain fields, creeks, ditches, and gutters. Nobody’s exactly sure what’s coming out of them. Seriously. I checked with the City of Bainbridge’s shoreline manager, whose job is to monitor the health of the beaches. “We don’t really know,” he admitted. We do know that there’s a lot of lawn fertilizer, dog poop, and road waste (oil and tire dust, mainly) going into Puget Sound, and it comes from thousands of micro sources. Like, say, pipes. I’m marking every one I come across, but I started too late, so my map is incomplete. Or perhaps it’s just getting started.
On days when high tides prevented hiking, I often wandered back to explore Blakely Harbor. In the late 1800s, a wharf of fir pilings and planking covered its pebbly shore. Immigrant workmen fed old-growth forests into one end of the buzz saw. Out the other end came the bones of the grandest homes in San Francisco. The mill closed decades ago. The only building that remains is the shell of the mill’s 1909 powerhouse, a stubborn symbol of the staying power of reinforced concrete. The building has become the shared canvas of local graffiti artists, who put up new pieces weekly. Teenagers hang out inside, smoking dope and drinking beer.
To map Blakely Harbor, I wanted to get small. I needed to practice hyper-locartography: the act of mapping per square foot, maybe even per square inch. But few tools let me go nose-to-the-ground. At a certain point even Google Earth blurs to pixels.
ADVERTISEMENT
Then a friend tipped me to Ortelius. MapDiva released this software for hand-drawn mapping last year (see left, it’s still only available for Macs). And unlike most freeware, once I got it started, it took off like a Ferrari. Blakely Harbor–my Blakely Harbor–came to colorful life on the screen. I added more details with every trip. The evolving map spurred further explorations. The world somehow became more interesting: an old steel cable sticking out of the mud like a leg bone in a cemetery; a beautifully marbled madrona tree. I pulled on a wet suit, paddled around on my surfboard, and discovered a sunken sailboat. Its stern was caught on the seafloor but its bow snouted up like an iceberg.
It didn’t take long before Ortelius went viral in my household. My kids already enjoyed flying over their schools or visiting exotic lands on Google Earth (Willie, a manga fanatic, liked to drill down into Tokyo), but the ability to create their own maps whole cloth sparked something new in their imaginations. They drew up make-believe lands like those conjured by J.K. Rowling and J.R.R. Tolkien. They even created maps of their own messy rooms–truly a navigational challenge worthy of George Vancouver.
I’ve printed out my own Ortelius map of Blakely Harbor a half-dozen times, but it keeps evolving. I keep adding to it. Same with my Google Earth map. New photos, interesting places, odd curiosities–they all get poured into the maps. The Google Earth map is so dense now that the “exploded pincushion” view completely obscures the island’s landmass. Even my hardcover guidebook, Mapping Bainbridge: Hiking My Way Home, has already been updated with new maps and photos: The second edition was printed three weeks after the first.
ADVERTISEMENT
They’re not just artifacts, these maps; they’re living documents. They change, and they’ve changed me as well. I keep my eye on the tide chart these days, like a surfer watching buoy reports. When it’s a super-minus or a high flood tide, I grab my hiking gear and go, searching for new discoveries on the coast. But when I go exploring now, I don’t feel like a foreign visitor. We’re no longer strangers, the island and me. I’ve put it on the map.
Bruce Barcott is the author of The Last Flight of the Scarlet Macaw.”Footprints Needed!”–his story about Colorado’s Black Canyon of the Gunnison National Park–appeared in September 2009.